Little Black Cormorant
Phalacrocorax sulcirostris
ABR description
The following is extracted from the Annual Bird Report for the twelve months to June 2017.
Very common, breeding resident
This species flocks in larger numbers in this region than other cormorants.
General: Total number of birds seen 5086, from 878 records, at a reporting rate of 6.2%, is up on the 30YA of 4.3%. Abundance A=0.3594 up 13% on the 30YA. Max 130/26 Sep Blue Gum Point GrK14 (SmA1), average 5.9, median 2. Recorded in every week of the year: winter 10%, spring 23%, summer 37% and autumn 30 % - a quite normal pattern. From 43 widespread grid cells, with 38% of records from GrL14 JWNR & FSP). 3 breeding records: nb/20 Jan JWNR (SmA1); dy/18 Feb Isabella Pond (HeS1); and on/18 Mar Gungahlin Pond (RoM1).
GBS: 85 records, and the reporting rate of 3.3% remains well up on the 30YA of 0.8%. From 37 weeks spread throughout the entire year, but with only 3.5% winter records. From 8 sites including Giralang, Jerrabomberra, LBG, Curtin, Crace and Lyneham.

Abundance
Abundance is the average number of birds of that species per survey. Where the species was observed (presence recorded) but the number of birds seen was not recorded, this is treated as a count of zero.
Abundance by year
This chart shows the abundance of Little Black Cormorant between 1982 and 2017. 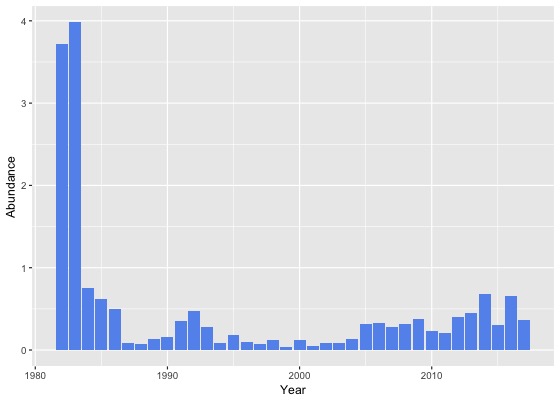
Abundance by month
This chart shows the monthly abundance of Little Black Cormorant. The blue lines show the abundance for the twelve months to June 2017 and the bars show the average abundance for the period 1982 to 2017. 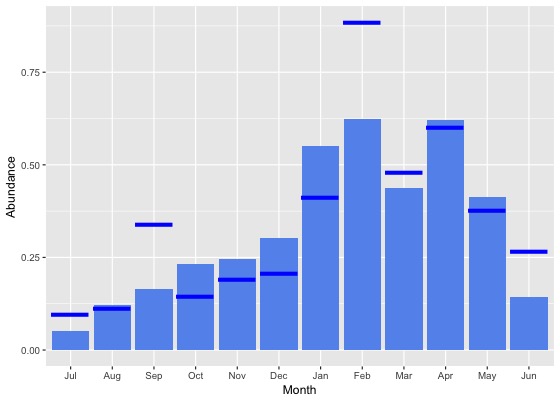
Abundance by season
This chart shows the seasonal abundance of Little Black Cormorant. The blue lines show the seasonal abundance for the twelve months to June 2017 and the bars show the average seasonal abundance for the period 1982 to 2017. 
Abundance data
| Month | Season | ||||||||||||||||||
|---|---|---|---|---|---|---|---|---|---|---|---|---|---|---|---|---|---|---|---|
| Period | Jul | Aug | Sep | Oct | Nov | Dec | Jan | Feb | Mar | Apr | May | Jun | Winter | Spring | Summer | Autumn | All | ||
| All years | |||||||||||||||||||
| All | 0.1 | 0.1 | 0.2 | 0.2 | 0.2 | 0.3 | 0.6 | 0.6 | 0.4 | 0.6 | 0.4 | 0.1 | 0.1 | 0.2 | 0.5 | 0.5 | 0.3 | ||
| Previous years | |||||||||||||||||||
| All previous years | 0.0 | 0.1 | 0.1 | 0.2 | 0.3 | 0.3 | 0.6 | 0.6 | 0.4 | 0.6 | 0.4 | 0.1 | 0.1 | 0.2 | 0.5 | 0.5 | 0.3 | ||
| Previous 30 years | 0.0 | 0.1 | 0.1 | 0.2 | 0.3 | 0.3 | 0.6 | 0.5 | 0.4 | 0.6 | 0.4 | 0.1 | 0.1 | 0.2 | 0.5 | 0.5 | 0.3 | ||
| Previous 20 years | 0.0 | 0.1 | 0.1 | 0.2 | 0.3 | 0.3 | 0.7 | 0.6 | 0.5 | 0.7 | 0.5 | 0.1 | 0.1 | 0.2 | 0.5 | 0.6 | 0.4 | ||
| 10 year groups | |||||||||||||||||||
| [2007,2017) | 0.1 | 0.1 | 0.2 | 0.3 | 0.4 | 0.4 | 0.7 | 0.7 | 0.7 | 0.9 | 0.4 | 0.1 | 0.1 | 0.3 | 0.6 | 0.7 | 0.4 | ||
| [1997,2007) | 0.0 | 0.1 | 0.1 | 0.1 | 0.1 | 0.1 | 0.3 | 0.3 | 0.1 | 0.1 | 0.5 | 0.1 | 0.1 | 0.1 | 0.2 | 0.2 | 0.1 | ||
| [1987,1997) | 0.1 | 0.1 | 0.1 | 0.3 | 0.2 | 0.2 | 0.2 | 0.2 | 0.1 | 0.1 | 0.2 | 0.1 | 0.1 | 0.2 | 0.2 | 0.2 | 0.2 | ||
| 5 year groups | |||||||||||||||||||
| [2012,2017) | 0.1 | 0.1 | 0.2 | 0.2 | 0.4 | 0.6 | 0.8 | 0.8 | 0.7 | 1.1 | 0.5 | 0.1 | 0.1 | 0.3 | 0.7 | 0.8 | 0.5 | ||
| [2007,2012) | 0.0 | 0.2 | 0.1 | 0.3 | 0.2 | 0.2 | 0.6 | 0.4 | 0.6 | 0.5 | 0.2 | 0.1 | 0.1 | 0.2 | 0.4 | 0.4 | 0.3 | ||
| [2002,2007) | 0.0 | 0.0 | 0.0 | 0.1 | 0.1 | 0.1 | 0.4 | 0.4 | 0.1 | 0.2 | 0.9 | 0.1 | 0.1 | 0.1 | 0.3 | 0.3 | 0.2 | ||
| [1997,2002) | 0.0 | 0.1 | 0.1 | 0.1 | 0.1 | 0.1 | 0.2 | 0.1 | 0.1 | 0.0 | 0.0 | 0.0 | 0.1 | 0.1 | 0.1 | 0.0 | 0.1 | ||
| [1992,1997) | 0.1 | 0.2 | 0.2 | 0.2 | 0.4 | 0.2 | 0.4 | 0.3 | 0.2 | 0.1 | 0.1 | 0.0 | 0.1 | 0.3 | 0.3 | 0.2 | 0.2 | ||
| [1987,1992) | 0.0 | 0.1 | 0.1 | 0.3 | 0.1 | 0.1 | 0.0 | 0.2 | 0.1 | 0.1 | 0.3 | 0.1 | 0.1 | 0.1 | 0.1 | 0.2 | 0.1 | ||
| Year | |||||||||||||||||||
| 2017 | 0.1 | 0.1 | 0.3 | 0.1 | 0.2 | 0.2 | 0.4 | 0.9 | 0.5 | 0.6 | 0.4 | 0.3 | 0.2 | 0.2 | 0.5 | 0.5 | 0.4 | ||
| 2016 | 0.1 | 0.0 | 0.1 | 0.4 | 0.4 | 0.6 | 0.7 | 0.5 | 0.8 | 2.2 | 0.9 | 0.2 | 0.1 | 0.3 | 0.6 | 1.4 | 0.7 | ||
| 2015 | 0.1 | 0.1 | 0.3 | 0.3 | 0.5 | 0.4 | 0.5 | 0.4 | 0.3 | 0.3 | 0.2 | 0.0 | 0.1 | 0.4 | 0.5 | 0.3 | 0.3 | ||
| 2014 | 0.0 | 0.2 | 0.6 | 0.2 | 0.4 | 0.3 | 1.7 | 1.4 | 0.7 | 0.7 | 0.1 | 0.3 | 0.2 | 0.4 | 1.3 | 0.6 | 0.7 | ||
| 2013 | 0.0 | 0.2 | 0.3 | 0.1 | 0.3 | 0.2 | 0.5 | 1.4 | 1.2 | 0.5 | 0.6 | 0.0 | 0.1 | 0.2 | 0.6 | 0.8 | 0.4 | ||
| 2012 | 0.0 | 0.0 | 0.0 | 0.1 | 0.5 | 1.5 | 0.7 | 1.5 | 0.5 | 0.1 | 0.1 | 0.0 | 0.0 | 0.2 | 1.1 | 0.3 | 0.4 | ||
| 2011 | 0.0 | 0.0 | 0.0 | 0.2 | 0.3 | 0.1 | 0.3 | 0.6 | 0.4 | 0.1 | 0.0 | 0.0 | 0.0 | 0.2 | 0.3 | 0.2 | 0.2 | ||
| 2010 | 0.0 | 0.0 | 0.1 | 0.2 | 0.0 | 0.0 | 0.2 | 1.0 | 0.9 | 0.3 | 0.2 | 0.0 | 0.0 | 0.1 | 0.2 | 0.6 | 0.2 | ||
| 2009 | 0.0 | 0.4 | 0.1 | 0.3 | 0.5 | 0.3 | 0.3 | 0.1 | 0.5 | 1.0 | 0.7 | 0.2 | 0.2 | 0.3 | 0.2 | 0.7 | 0.4 | ||
| 2008 | 0.0 | 0.0 | 0.2 | 0.1 | 0.0 | 0.6 | 1.8 | 0.0 | 1.0 | 0.4 | 0.1 | 0.2 | 0.1 | 0.1 | 0.8 | 0.5 | 0.3 | ||
| 2007 | 0.0 | 0.5 | 0.0 | 0.5 | 0.1 | 0.0 | 0.8 | 0.0 | 0.2 | 0.6 | 0.0 | 0.0 | 0.1 | 0.3 | 0.3 | 0.3 | 0.3 | ||
| 2006 | 0.0 | 0.0 | 0.1 | 0.2 | 0.1 | 0.1 | 0.9 | 0.1 | 0.1 | 0.5 | 2.1 | 0.4 | 0.2 | 0.2 | 0.4 | 0.6 | 0.3 | ||
| 2005 | 0.0 | 0.1 | 0.1 | 0.1 | 0.1 | 0.5 | 0.6 | 2.0 | 0.2 | 0.0 | 1.1 | 0.0 | 0.0 | 0.1 | 0.8 | 0.4 | 0.3 | ||
| 2004 | 0.0 | 0.0 | 0.0 | 0.3 | 0.2 | 0.1 | 0.4 | 0.1 | 0.0 | 0.3 | 0.4 | 0.0 | 0.0 | 0.2 | 0.2 | 0.2 | 0.1 | ||
| 2003 | 0.0 | 0.0 | 0.0 | 0.0 | 0.0 | 0.0 | 0.0 | 0.3 | 0.2 | 0.2 | 0.1 | 0.1 | 0.0 | 0.0 | 0.1 | 0.2 | 0.1 | ||
| 2002 | 0.0 | 0.0 | 0.0 | 0.0 | 0.1 | 0.1 | 0.2 | 0.3 | 0.1 | 0.1 | 0.0 | 0.2 | 0.1 | 0.1 | 0.1 | 0.1 | 0.1 | ||
| 2001 | 0.0 | 0.0 | 0.1 | 0.1 | 0.1 | 0.0 | 0.2 | 0.1 | 0.0 | 0.0 | 0.0 | 0.0 | 0.0 | 0.1 | 0.1 | 0.0 | 0.0 | ||
| 2000 | 0.1 | 0.5 | 0.1 | 0.2 | 0.1 | 0.1 | 0.2 | 0.1 | 0.1 | 0.0 | 0.1 | 0.0 | 0.2 | 0.1 | 0.1 | 0.1 | 0.1 | ||
| 1999 | 0.1 | 0.0 | 0.0 | 0.1 | 0.0 | 0.0 | 0.1 | 0.0 | 0.0 | 0.0 | 0.0 | 0.1 | 0.1 | 0.0 | 0.1 | 0.0 | 0.0 | ||
| 1998 | 0.0 | 0.0 | 0.0 | 0.1 | 0.0 | 0.1 | 0.7 | 0.0 | 0.1 | 0.1 | 0.2 | 0.1 | 0.1 | 0.0 | 0.3 | 0.1 | 0.1 | ||
| 1997 | 0.0 | 0.1 | 0.0 | 0.1 | 0.2 | 0.0 | 0.1 | 0.0 | 0.1 | 0.1 | 0.0 | 0.0 | 0.0 | 0.1 | 0.1 | 0.1 | 0.1 | ||
| 1996 | 0.1 | 0.0 | 0.0 | 0.1 | 0.2 | 0.1 | 0.4 | 0.0 | 0.1 | 0.0 | 0.0 | 0.0 | 0.0 | 0.1 | 0.2 | 0.1 | 0.1 | ||
| 1995 | 0.1 | 0.2 | 0.0 | 0.1 | 0.5 | 0.4 | 0.3 | 0.1 | 0.3 | 0.1 | 0.0 | 0.0 | 0.1 | 0.2 | 0.3 | 0.2 | 0.2 | ||
| 1994 | 0.2 | 0.3 | 0.0 | 0.3 | 0.0 | 0.1 | 0.1 | 0.0 | 0.0 | 0.0 | 0.0 | 0.0 | 0.1 | 0.1 | 0.1 | 0.0 | 0.1 | ||
| 1993 | 0.1 | 0.2 | 0.1 | 0.0 | 1.3 | 0.0 | 0.3 | 1.2 | 0.2 | 0.0 | 0.1 | 0.1 | 0.1 | 0.5 | 0.4 | 0.1 | 0.3 | ||
| 1992 | 0.1 | 0.1 | 0.6 | 0.8 | 0.3 | 0.3 | 1.1 | 1.1 | 0.5 | 0.5 | 0.4 | 0.0 | 0.1 | 0.6 | 0.8 | 0.5 | 0.5 | ||
| 1991 | 0.0 | 0.1 | 0.1 | 0.4 | 0.2 | 0.1 | 0.1 | 0.7 | 0.4 | 0.0 | 2.5 | 0.1 | 0.1 | 0.2 | 0.3 | 1.0 | 0.3 | ||
| 1990 | 0.0 | 0.1 | 0.0 | 0.2 | 0.0 | 0.1 | 0.1 | 0.6 | 0.1 | 0.4 | 0.3 | 0.3 | 0.1 | 0.1 | 0.3 | 0.3 | 0.2 | ||
| 1989 | 0.1 | 0.3 | 0.1 | 0.5 | 0.0 | 0.1 | 0.0 | 0.1 | 0.1 | 0.1 | 0.0 | 0.1 | 0.1 | 0.2 | 0.1 | 0.1 | 0.1 | ||
| 1988 | 0.0 | 0.1 | 0.1 | 0.1 | 0.0 | 0.2 | 0.0 | 0.1 | 0.0 | 0.3 | 0.0 | 0.1 | 0.1 | 0.1 | 0.1 | 0.1 | 0.1 | ||
| 1987 | 0.1 | 0.1 | 0.0 | 0.2 | 0.0 | 0.2 | 0.1 | 0.1 | 0.0 | 0.0 | 0.0 | 0.1 | 0.1 | 0.1 | 0.1 | 0.0 | 0.1 | ||
| 1986 | 0.0 | 0.2 | 0.3 | 0.8 | 0.1 | 1.4 | 0.1 | 0.9 | 0.0 | 1.5 | 0.0 | 0.2 | 0.1 | 0.4 | 0.9 | 0.7 | 0.5 | ||
| 1985 | 0.0 | 0.6 | 0.0 | 0.4 | 0.2 | 0.7 | 0.0 | 3.9 | 0.2 | 3.2 | 0.2 | 0.7 | 0.4 | 0.2 | 1.3 | 1.6 | 0.6 | ||
| 1984 | 0.0 | 2.8 | 0.2 | 4.1 | 0.0 | 2.2 | 0.3 | 0.8 | 0.0 | 0.9 | 0.0 | 0.3 | 0.8 | 2.4 | 0.8 | 0.3 | 0.8 | ||
| 1983 | 1.3 | 4.2 | 0.0 | 5.9 | 0.3 | 2.1 | 0.0 | 6.9 | 0.0 | - | 9.9 | 3.5 | 3.3 | 3.0 | 3.4 | 8.5 | 4.0 | ||
| 1982 | - | 1.7 | - | 0.0 | 4.9 | 1.1 | - | 6.2 | - | 6.2 | - | 3.2 | 2.6 | 4.3 | 3.4 | 6.2 | 3.7 | ||
Reporting rates
Reporting rate is the proportion of all surveys in which the species was present.
Reporting rate by year
This chart shows the reporting rate of Little Black Cormorant each year between 1982 and 2017. 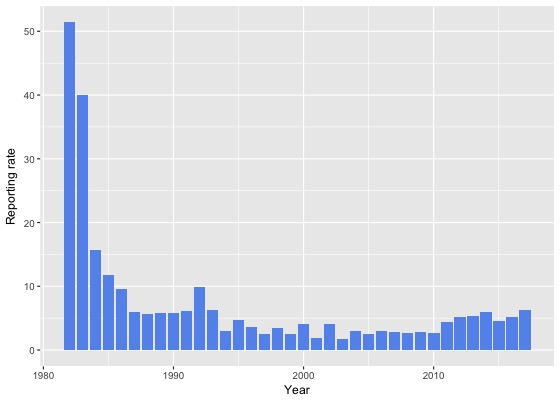
Reporting rate by month
This chart shows the reporting rate by month of Little Black Cormorant. The blue lines show the reporting rate for the twelve months to June 2017 and the bars show the average reporting rate for the period 1982 to 2017. 
Reporting rate by season
This chart shows the seasonal reporting rate of Little Black Cormorant. The blue lines show the seasonal reporting rate for the twelve months to June 2017 and the bars show the average seasonal reporting rate for the period 1982 to 2017. 
Reporting rate data
| Month | Season | ||||||||||||||||||
|---|---|---|---|---|---|---|---|---|---|---|---|---|---|---|---|---|---|---|---|
| Period | Jul | Aug | Sep | Oct | Nov | Dec | Jan | Feb | Mar | Apr | May | Jun | Winter | Spring | Summer | Autumn | All | ||
| All years | |||||||||||||||||||
| All | 2.6 | 3.6 | 3.0 | 4.7 | 4.9 | 5.2 | 6.7 | 8.2 | 5.3 | 5.1 | 4.7 | 2.5 | 2.9 | 4.2 | 6.6 | 5.1 | 4.8 | ||
| Previous years | |||||||||||||||||||
| All previous years | 2.3 | 3.7 | 2.8 | 4.5 | 4.5 | 4.8 | 6.3 | 7.9 | 4.7 | 4.8 | 4.8 | 2.7 | 2.9 | 4.0 | 6.2 | 4.8 | 4.5 | ||
| Previous 30 years | 2.3 | 3.2 | 2.8 | 4.3 | 4.3 | 4.4 | 6.3 | 7.5 | 4.7 | 4.5 | 4.8 | 2.4 | 2.6 | 3.8 | 6.0 | 4.7 | 4.3 | ||
| Previous 20 years | 1.7 | 2.3 | 2.3 | 3.8 | 4.1 | 4.2 | 6.5 | 7.2 | 4.6 | 4.3 | 4.9 | 2.0 | 2.0 | 3.4 | 5.9 | 4.6 | 4.1 | ||
| 10 year groups | |||||||||||||||||||
| [2007,2017) | 2.1 | 2.4 | 2.4 | 3.7 | 4.5 | 4.7 | 6.9 | 8.6 | 5.7 | 4.9 | 5.5 | 2.1 | 2.2 | 3.5 | 6.7 | 5.4 | 4.6 | ||
| [1997,2007) | 1.1 | 2.3 | 2.1 | 4.0 | 3.2 | 3.2 | 5.1 | 3.5 | 2.3 | 2.6 | 3.5 | 1.7 | 1.7 | 3.1 | 3.8 | 2.7 | 2.9 | ||
| [1987,1997) | 4.3 | 6.0 | 5.1 | 7.3 | 5.1 | 5.8 | 5.3 | 8.9 | 5.1 | 6.0 | 4.2 | 4.5 | 5.0 | 5.9 | 6.6 | 5.1 | 5.6 | ||
| 5 year groups | |||||||||||||||||||
| [2012,2017) | 2.3 | 2.4 | 2.6 | 4.2 | 5.3 | 5.7 | 7.0 | 9.0 | 6.2 | 5.6 | 6.3 | 2.7 | 2.5 | 4.0 | 7.2 | 6.0 | 5.1 | ||
| [2007,2012) | 1.3 | 2.2 | 2.0 | 3.0 | 2.5 | 2.5 | 6.6 | 7.3 | 4.3 | 3.2 | 3.2 | 1.1 | 1.4 | 2.6 | 5.0 | 3.6 | 3.2 | ||
| [2002,2007) | 1.0 | 1.3 | 1.8 | 3.6 | 2.3 | 3.6 | 5.4 | 3.8 | 2.8 | 3.4 | 4.1 | 1.5 | 1.3 | 2.6 | 4.2 | 3.3 | 2.9 | ||
| [1997,2002) | 1.4 | 3.4 | 2.5 | 4.7 | 4.1 | 2.6 | 4.7 | 3.2 | 1.7 | 1.6 | 2.6 | 1.9 | 2.2 | 3.7 | 3.4 | 1.9 | 2.9 | ||
| [1992,1997) | 5.5 | 5.6 | 5.1 | 5.6 | 7.5 | 4.4 | 7.4 | 6.8 | 4.5 | 4.3 | 4.3 | 1.5 | 4.2 | 6.1 | 6.2 | 4.4 | 5.2 | ||
| [1987,1992) | 3.7 | 6.2 | 5.2 | 8.2 | 4.0 | 6.4 | 4.1 | 9.7 | 5.4 | 6.9 | 4.1 | 6.2 | 5.4 | 5.8 | 6.8 | 5.5 | 5.9 | ||
| Year | |||||||||||||||||||
| 2017 | 4.6 | 3.0 | 4.1 | 5.8 | 7.2 | 7.7 | 8.6 | 9.4 | 8.7 | 7.2 | 4.4 | 1.7 | 2.8 | 5.7 | 8.6 | 6.9 | 6.2 | ||
| 2016 | 1.4 | 1.2 | 1.6 | 3.7 | 5.2 | 7.7 | 6.7 | 8.1 | 7.0 | 6.3 | 7.0 | 3.3 | 2.0 | 3.4 | 7.5 | 6.7 | 5.2 | ||
| 2015 | 5.1 | 2.7 | 4.0 | 4.9 | 4.4 | 4.9 | 4.2 | 7.2 | 5.7 | 5.1 | 4.3 | 0.9 | 2.5 | 4.5 | 5.3 | 5.1 | 4.5 | ||
| 2014 | 1.2 | 4.6 | 3.1 | 4.9 | 2.6 | 4.6 | 8.1 | 12.1 | 6.1 | 4.3 | 6.2 | 6.8 | 5.0 | 3.9 | 8.6 | 5.6 | 5.9 | ||
| 2013 | 2.3 | 6.3 | 3.8 | 4.6 | 8.7 | 2.7 | 7.8 | 7.3 | 5.1 | 6.5 | 7.9 | 1.4 | 3.2 | 5.5 | 5.7 | 6.2 | 5.4 | ||
| 2012 | 0.8 | 0.4 | 0.5 | 3.0 | 5.2 | 8.4 | 10.3 | 16.1 | 6.5 | 5.0 | 7.5 | 1.5 | 1.0 | 2.9 | 10.7 | 6.1 | 5.2 | ||
| 2011 | 1.6 | 2.4 | 1.6 | 4.0 | 3.0 | 6.0 | 9.2 | 14.6 | 2.8 | 3.4 | 2.5 | 0.9 | 1.4 | 3.2 | 9.3 | 3.0 | 4.4 | ||
| 2010 | 2.1 | 0.0 | 3.4 | 2.9 | 1.4 | 0.7 | 3.4 | 8.2 | 4.3 | 2.1 | 4.9 | 1.1 | 1.1 | 2.7 | 2.8 | 3.6 | 2.6 | ||
| 2009 | 0.7 | 5.2 | 1.5 | 2.4 | 4.5 | 1.1 | 4.0 | 2.5 | 5.1 | 3.3 | 3.8 | 1.4 | 2.0 | 2.6 | 2.4 | 4.1 | 2.8 | ||
| 2008 | 1.4 | 2.6 | 2.6 | 2.2 | 0.7 | 2.7 | 10.3 | 1.9 | 3.8 | 2.8 | 2.7 | 0.9 | 1.5 | 2.1 | 4.6 | 3.1 | 2.7 | ||
| 2007 | 1.1 | 0.9 | 0.8 | 3.4 | 2.0 | 1.0 | 5.5 | 2.6 | 6.0 | 4.3 | 3.3 | 1.3 | 1.2 | 2.4 | 3.0 | 4.7 | 2.9 | ||
| 2006 | 1.3 | 0.0 | 1.8 | 2.0 | 0.6 | 1.7 | 6.7 | 3.7 | 3.8 | 6.5 | 5.1 | 2.7 | 1.7 | 1.7 | 4.1 | 4.8 | 3.0 | ||
| 2005 | 0.7 | 2.8 | 1.1 | 3.3 | 4.1 | 1.6 | 4.3 | 7.6 | 2.2 | 1.6 | 4.5 | 0.8 | 1.2 | 2.5 | 3.5 | 2.8 | 2.5 | ||
| 2004 | 0.4 | 1.3 | 2.4 | 5.8 | 2.9 | 3.2 | 5.5 | 3.0 | 3.1 | 2.7 | 4.9 | 1.8 | 1.1 | 3.6 | 4.0 | 3.3 | 2.9 | ||
| 2003 | 1.7 | 0.0 | 0.8 | 3.1 | 1.4 | 1.7 | 2.2 | 2.2 | 1.8 | 2.8 | 1.6 | 0.6 | 0.7 | 1.7 | 2.0 | 2.1 | 1.7 | ||
| 2002 | 1.1 | 2.5 | 3.0 | 5.2 | 3.0 | 7.7 | 7.5 | 3.9 | 2.7 | 3.6 | 4.7 | 1.6 | 1.7 | 3.8 | 6.8 | 3.4 | 4.1 | ||
| 2001 | 0.4 | 0.6 | 2.1 | 2.9 | 3.4 | 2.2 | 4.0 | 2.6 | 0.9 | 1.5 | 2.3 | 0.5 | 0.5 | 2.7 | 2.8 | 1.4 | 1.9 | ||
| 2000 | 3.2 | 8.5 | 3.7 | 6.2 | 7.4 | 3.7 | 5.4 | 4.3 | 2.4 | 1.8 | 1.8 | 0.5 | 3.9 | 5.8 | 4.4 | 2.1 | 4.1 | ||
| 1999 | 2.9 | 1.0 | 2.9 | 5.0 | 1.9 | 3.1 | 3.6 | 2.1 | 1.1 | 1.0 | 2.3 | 3.3 | 2.6 | 3.3 | 3.0 | 1.4 | 2.5 | ||
| 1998 | 0.0 | 1.9 | 2.4 | 3.3 | 0.9 | 1.9 | 7.4 | 1.9 | 3.2 | 5.1 | 14.8 | 6.7 | 3.6 | 2.1 | 3.5 | 5.7 | 3.4 | ||
| 1997 | 1.1 | 3.4 | 0.9 | 6.6 | 5.1 | 1.0 | 3.9 | 5.3 | 2.5 | 0.9 | 0.0 | 0.0 | 1.4 | 4.0 | 2.8 | 1.0 | 2.5 | ||
| 1996 | 4.5 | 2.1 | 2.7 | 5.3 | 5.6 | 4.0 | 6.8 | 1.2 | 3.9 | 1.6 | 3.4 | 0.0 | 2.0 | 4.7 | 4.2 | 3.1 | 3.6 | ||
| 1995 | 4.3 | 5.4 | 4.9 | 4.9 | 4.5 | 3.4 | 7.1 | 4.8 | 4.1 | 6.5 | 2.6 | 3.2 | 4.4 | 4.8 | 5.3 | 4.7 | 4.8 | ||
| 1994 | 5.9 | 7.8 | 1.5 | 4.7 | 2.9 | 4.3 | 2.9 | 1.7 | 2.3 | 2.3 | 1.2 | 0.0 | 4.1 | 3.1 | 2.9 | 2.0 | 3.0 | ||
| 1993 | 10.2 | 6.4 | 1.6 | 5.3 | 18.2 | 2.2 | 8.2 | 21.9 | 2.5 | 3.3 | 2.6 | 2.9 | 6.1 | 8.4 | 9.4 | 2.8 | 6.3 | ||
| 1992 | 4.6 | 7.4 | 12.9 | 8.5 | 13.9 | 7.9 | 13.8 | 17.1 | 11.3 | 8.5 | 11.8 | 1.7 | 4.5 | 11.6 | 12.3 | 10.7 | 9.9 | ||
| 1991 | 0.8 | 5.3 | 2.3 | 6.8 | 6.2 | 4.1 | 5.4 | 18.0 | 12.7 | 3.4 | 11.5 | 6.0 | 3.3 | 5.2 | 8.3 | 9.3 | 6.1 | ||
| 1990 | 3.9 | 3.8 | 4.3 | 5.1 | 2.8 | 4.2 | 8.3 | 11.3 | 6.8 | 11.9 | 6.8 | 7.9 | 4.6 | 4.0 | 7.9 | 8.6 | 5.9 | ||
| 1989 | 5.6 | 7.3 | 6.1 | 8.5 | 5.1 | 4.8 | 0.5 | 10.3 | 6.1 | 6.2 | 2.6 | 4.2 | 5.9 | 6.7 | 5.2 | 5.1 | 5.8 | ||
| 1988 | 3.0 | 6.7 | 6.2 | 8.2 | 3.1 | 7.7 | 2.5 | 8.0 | 4.0 | 11.2 | 3.0 | 6.3 | 5.4 | 5.7 | 6.0 | 6.0 | 5.7 | ||
| 1987 | 18.2 | 13.3 | 4.9 | 9.8 | 3.9 | 8.5 | 7.2 | 8.3 | 3.3 | 3.3 | 3.1 | 7.4 | 8.3 | 6.0 | 8.0 | 3.2 | 6.0 | ||
| 1986 | 0.0 | 7.9 | 11.3 | 13.9 | 4.3 | 17.6 | 8.7 | 16.7 | 6.5 | 11.8 | 3.4 | 8.6 | 6.1 | 9.6 | 15.1 | 8.1 | 9.6 | ||
| 1985 | 0.0 | 26.7 | 3.8 | 10.5 | 10.5 | 10.0 | 0.0 | 29.4 | 9.1 | 42.1 | 10.0 | 7.1 | 11.4 | 8.7 | 12.9 | 25.0 | 11.8 | ||
| 1984 | 0.0 | 70.0 | 20.0 | 50.0 | 0.0 | 58.3 | 6.9 | 21.2 | 0.0 | 8.8 | 0.0 | 11.8 | 22.4 | 33.3 | 21.6 | 3.3 | 15.7 | ||
| 1983 | 16.7 | 41.7 | 0.0 | 61.5 | 33.3 | 53.8 | 0.0 | 63.6 | 0.0 | - | 41.7 | 36.4 | 34.5 | 40.7 | 46.7 | 35.7 | 40.0 | ||
| 1982 | - | 45.5 | - | 0.0 | 75.0 | 35.7 | - | 63.6 | - | 53.8 | - | 50.0 | 48.0 | 66.7 | 48.0 | 53.8 | 51.4 | ||
Breeding data
Breeding records by month
Number of breeding records by breeding code and month, 2017 and all years| Breeding code | Jul | Aug | Sep | Oct | Nov | Dec | Jan | Feb | Mar | Apr | May | Jun |
|---|---|---|---|---|---|---|---|---|---|---|---|---|
| 2017 | ||||||||||||
| Breeding (BLA code) | 0 | 0 | 0 | 0 | 0 | 0 | 0 | 0 | 0 | 0 | 0 | 0 |
| Carrying Food | 0 | 0 | 0 | 0 | 0 | 0 | 0 | 0 | 0 | 0 | 0 | 0 |
| Copulating | 0 | 0 | 0 | 0 | 0 | 0 | 0 | 0 | 0 | 0 | 0 | 0 |
| Display | 0 | 0 | 0 | 0 | 0 | 0 | 0 | 0 | 0 | 0 | 0 | 0 |
| Dependent young | 0 | 0 | 0 | 0 | 0 | 0 | 0 | 1 | 0 | 0 | 0 | 0 |
| Faecal sac | 0 | 0 | 0 | 0 | 0 | 0 | 0 | 0 | 0 | 0 | 0 | 0 |
| Inspecting hollow | 0 | 0 | 0 | 0 | 0 | 0 | 0 | 0 | 0 | 0 | 0 | 0 |
| Nest building | 0 | 0 | 0 | 0 | 0 | 0 | 1 | 0 | 0 | 0 | 0 | 0 |
| Nest with eggs | 0 | 0 | 0 | 0 | 0 | 0 | 0 | 0 | 0 | 0 | 0 | 0 |
| Nest with young | 0 | 0 | 0 | 0 | 0 | 0 | 0 | 0 | 0 | 0 | 0 | 0 |
| On/leaving nest | 0 | 0 | 0 | 0 | 0 | 0 | 0 | 0 | 1 | 0 | 0 | 0 |
| All years | ||||||||||||
| Breeding (BLA code) | 0 | 0 | 0 | 0 | 0 | 0 | 0 | 1 | 0 | 0 | 0 | 0 |
| Carrying Food | 0 | 0 | 0 | 0 | 0 | 0 | 0 | 0 | 0 | 0 | 0 | 0 |
| Copulating | 0 | 0 | 0 | 0 | 0 | 0 | 0 | 1 | 0 | 0 | 0 | 0 |
| Display | 0 | 0 | 0 | 0 | 0 | 0 | 0 | 0 | 0 | 0 | 0 | 0 |
| Dependent young | 0 | 0 | 0 | 0 | 0 | 2 | 0 | 2 | 1 | 1 | 3 | 0 |
| Faecal sac | 0 | 0 | 0 | 0 | 0 | 0 | 0 | 0 | 0 | 0 | 0 | 0 |
| Inspecting hollow | 0 | 0 | 0 | 0 | 0 | 0 | 0 | 0 | 0 | 0 | 0 | 0 |
| Nest building | 0 | 0 | 0 | 1 | 0 | 0 | 1 | 1 | 0 | 0 | 0 | 0 |
| Nest with eggs | 0 | 0 | 0 | 0 | 1 | 0 | 0 | 0 | 0 | 0 | 0 | 0 |
| Nest with young | 0 | 0 | 0 | 1 | 0 | 1 | 5 | 3 | 5 | 1 | 0 | 0 |
| On/leaving nest | 0 | 0 | 1 | 1 | 0 | 3 | 5 | 7 | 2 | 1 | 0 | 0 |
Breeding records by year
Average number of breeding records per period by breeding code| Period | Breeding (BLA code) | Carrying Food | Copulating | Display | Dependent young | Faecal sac | Inspecting hollow | Nest building | Nest with eggs | Nest with young | On/leaving nest |
|---|---|---|---|---|---|---|---|---|---|---|---|
| All years | |||||||||||
| All | 0.0 | 0.0 | 0.0 | 0.0 | 0.2 | 0.0 | 0.0 | 0.1 | 0.0 | 0.4 | 0.6 |
| Previous years | |||||||||||
| All previous years | 0.0 | 0.0 | 0.0 | 0.0 | 0.2 | 0.0 | 0.0 | 0.1 | 0.0 | 0.5 | 0.5 |
| Previous 30 years | 0.0 | 0.0 | 0.0 | 0.0 | 0.3 | 0.0 | 0.0 | 0.1 | 0.0 | 0.5 | 0.6 |
| Previous 20 years | 0.0 | 0.0 | 0.0 | 0.0 | 0.3 | 0.0 | 0.0 | 0.0 | 0.0 | 0.7 | 0.9 |
| 10 year groups | |||||||||||
| [2007,2017) | 0.1 | 0.0 | 0.1 | 0.0 | 0.2 | 0.0 | 0.0 | 0.1 | 0.0 | 1.0 | 1.1 |
| [1997,2007) | 0.0 | 0.0 | 0.0 | 0.0 | 0.4 | 0.0 | 0.0 | 0.0 | 0.1 | 0.4 | 0.7 |
| [1987,1997) | 0.0 | 0.0 | 0.0 | 0.0 | 0.2 | 0.0 | 0.0 | 0.1 | 0.0 | 0.2 | 0.0 |
| 5 year groups | |||||||||||
| [2012,2017) | 0.2 | 0.0 | 0.0 | 0.0 | 0.0 | 0.0 | 0.0 | 0.0 | 0.0 | 0.0 | 0.0 |
| [2007,2012) | 0.0 | 0.0 | 0.2 | 0.0 | 0.4 | 0.0 | 0.0 | 0.2 | 0.0 | 2.0 | 2.2 |
| [2002,2007) | 0.0 | 0.0 | 0.0 | 0.0 | 0.8 | 0.0 | 0.0 | 0.0 | 0.0 | 0.8 | 1.4 |
| [1997,2002) | 0.0 | 0.0 | 0.0 | 0.0 | 0.0 | 0.0 | 0.0 | 0.0 | 0.2 | 0.0 | 0.0 |
| [1992,1997) | 0.0 | 0.0 | 0.0 | 0.0 | 0.4 | 0.0 | 0.0 | 0.0 | 0.0 | 0.0 | 0.0 |
| [1987,1992) | 0.0 | 0.0 | 0.0 | 0.0 | 0.0 | 0.0 | 0.0 | 0.2 | 0.0 | 0.4 | 0.0 |
| Year | |||||||||||
| 2017 | 0.0 | 0.0 | 0.0 | 0.0 | 1.0 | 0.0 | 0.0 | 1.0 | 0.0 | 0.0 | 1.0 |
| 2016 | 0.0 | 0.0 | 0.0 | 0.0 | 0.0 | 0.0 | 0.0 | 0.0 | 0.0 | 0.0 | 0.0 |
| 2015 | 0.0 | 0.0 | 0.0 | 0.0 | 0.0 | 0.0 | 0.0 | 0.0 | 0.0 | 0.0 | 0.0 |
| 2014 | 0.0 | 0.0 | 0.0 | 0.0 | 0.0 | 0.0 | 0.0 | 0.0 | 0.0 | 0.0 | 0.0 |
| 2013 | 0.0 | 0.0 | 0.0 | 0.0 | 0.0 | 0.0 | 0.0 | 0.0 | 0.0 | 0.0 | 0.0 |
| 2012 | 1.0 | 0.0 | 0.0 | 0.0 | 0.0 | 0.0 | 0.0 | 0.0 | 0.0 | 0.0 | 0.0 |
| 2011 | 0.0 | 0.0 | 1.0 | 0.0 | 0.0 | 0.0 | 0.0 | 0.0 | 0.0 | 2.0 | 7.0 |
| 2010 | 0.0 | 0.0 | 0.0 | 0.0 | 1.0 | 0.0 | 0.0 | 0.0 | 0.0 | 3.0 | 3.0 |
| 2009 | 0.0 | 0.0 | 0.0 | 0.0 | 0.0 | 0.0 | 0.0 | 1.0 | 0.0 | 0.0 | 0.0 |
| 2008 | 0.0 | 0.0 | 0.0 | 0.0 | 1.0 | 0.0 | 0.0 | 0.0 | 0.0 | 4.0 | 1.0 |
| 2007 | 0.0 | 0.0 | 0.0 | 0.0 | 0.0 | 0.0 | 0.0 | 0.0 | 0.0 | 1.0 | 0.0 |
| 2006 | 0.0 | 0.0 | 0.0 | 0.0 | 0.0 | 0.0 | 0.0 | 0.0 | 0.0 | 3.0 | 0.0 |
| 2005 | 0.0 | 0.0 | 0.0 | 0.0 | 1.0 | 0.0 | 0.0 | 0.0 | 0.0 | 1.0 | 5.0 |
| 2004 | 0.0 | 0.0 | 0.0 | 0.0 | 3.0 | 0.0 | 0.0 | 0.0 | 0.0 | 0.0 | 2.0 |
| 2003 | 0.0 | 0.0 | 0.0 | 0.0 | 0.0 | 0.0 | 0.0 | 0.0 | 0.0 | 0.0 | 0.0 |
| 2002 | 0.0 | 0.0 | 0.0 | 0.0 | 0.0 | 0.0 | 0.0 | 0.0 | 0.0 | 0.0 | 0.0 |
| 2001 | 0.0 | 0.0 | 0.0 | 0.0 | 0.0 | 0.0 | 0.0 | 0.0 | 0.0 | 0.0 | 0.0 |
| 2000 | 0.0 | 0.0 | 0.0 | 0.0 | 0.0 | 0.0 | 0.0 | 0.0 | 0.0 | 0.0 | 0.0 |
| 1999 | 0.0 | 0.0 | 0.0 | 0.0 | 0.0 | 0.0 | 0.0 | 0.0 | 0.0 | 0.0 | 0.0 |
| 1998 | 0.0 | 0.0 | 0.0 | 0.0 | 0.0 | 0.0 | 0.0 | 0.0 | 0.0 | 0.0 | 0.0 |
| 1997 | 0.0 | 0.0 | 0.0 | 0.0 | 0.0 | 0.0 | 0.0 | 0.0 | 1.0 | 0.0 | 0.0 |
| 1996 | 0.0 | 0.0 | 0.0 | 0.0 | 2.0 | 0.0 | 0.0 | 0.0 | 0.0 | 0.0 | 0.0 |
| 1995 | 0.0 | 0.0 | 0.0 | 0.0 | 0.0 | 0.0 | 0.0 | 0.0 | 0.0 | 0.0 | 0.0 |
| 1994 | 0.0 | 0.0 | 0.0 | 0.0 | 0.0 | 0.0 | 0.0 | 0.0 | 0.0 | 0.0 | 0.0 |
| 1993 | 0.0 | 0.0 | 0.0 | 0.0 | 0.0 | 0.0 | 0.0 | 0.0 | 0.0 | 0.0 | 0.0 |
| 1992 | 0.0 | 0.0 | 0.0 | 0.0 | 0.0 | 0.0 | 0.0 | 0.0 | 0.0 | 0.0 | 0.0 |
| 1991 | 0.0 | 0.0 | 0.0 | 0.0 | 0.0 | 0.0 | 0.0 | 0.0 | 0.0 | 1.0 | 0.0 |
| 1990 | 0.0 | 0.0 | 0.0 | 0.0 | 0.0 | 0.0 | 0.0 | 0.0 | 0.0 | 0.0 | 0.0 |
| 1989 | 0.0 | 0.0 | 0.0 | 0.0 | 0.0 | 0.0 | 0.0 | 0.0 | 0.0 | 1.0 | 0.0 |
| 1988 | 0.0 | 0.0 | 0.0 | 0.0 | 0.0 | 0.0 | 0.0 | 1.0 | 0.0 | 0.0 | 0.0 |
| 1987 | 0.0 | 0.0 | 0.0 | 0.0 | 0.0 | 0.0 | 0.0 | 0.0 | 0.0 | 0.0 | 0.0 |
| 1986 | 0.0 | 0.0 | 0.0 | 0.0 | 0.0 | 0.0 | 0.0 | 0.0 | 0.0 | 0.0 | 0.0 |
| 1985 | 0.0 | 0.0 | 0.0 | 0.0 | 0.0 | 0.0 | 0.0 | 0.0 | 0.0 | 0.0 | 0.0 |
| 1984 | 0.0 | 0.0 | 0.0 | 0.0 | 0.0 | 0.0 | 0.0 | 0.0 | 0.0 | 0.0 | 0.0 |
| 1983 | 0.0 | 0.0 | 0.0 | 0.0 | 0.0 | 0.0 | 0.0 | 0.0 | 0.0 | 0.0 | 0.0 |
| 1982 | 0.0 | 0.0 | 0.0 | 0.0 | 0.0 | 0.0 | 0.0 | 0.0 | 0.0 | 0.0 | 1.0 |
Distribution map
Distribution - 2017
This map shows the observed distribution of the Little Black Cormorant for 2017.
The red circles are the grid cells where Little Black Cormorant have been reported.
The transparency of the red circles indicate how many surveys sheets were submitted for that grid cell; the darker the red the more reliable the data. Of the 315 grid cells with reports, 83 had only one sheet; an example is grid number A11.
The size of the circle represents the reporting rate. The maximum reporting rate for Little Black Cormorant was 71.4% (eg grid number D6) and the minimum was 0.1% (eg grid number K15). 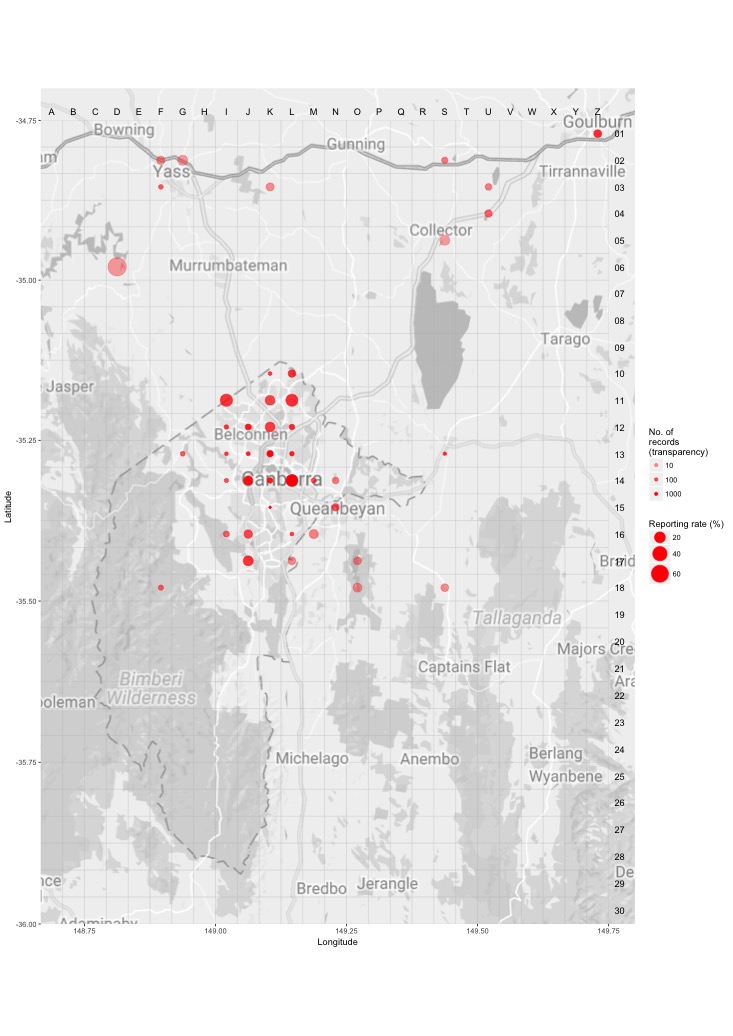
Distribution - all years
This map shows the observed distribution of the Little Black Cormorant for all years.
The red circles are the grid cells where Little Black Cormorant have been reported.
The transparency of the red circles indicate how many surveys sheets were submitted for that grid cell; the darker the red the more reliable the data. Of the 703 grid cells with reports, 55 had only one sheet; an example is grid number A12.
The size of the circle represents the reporting rate. The maximum reporting rate for Little Black Cormorant was 50.0% (eg grid number B6) and the minimum was 0.0% (eg grid number K16). 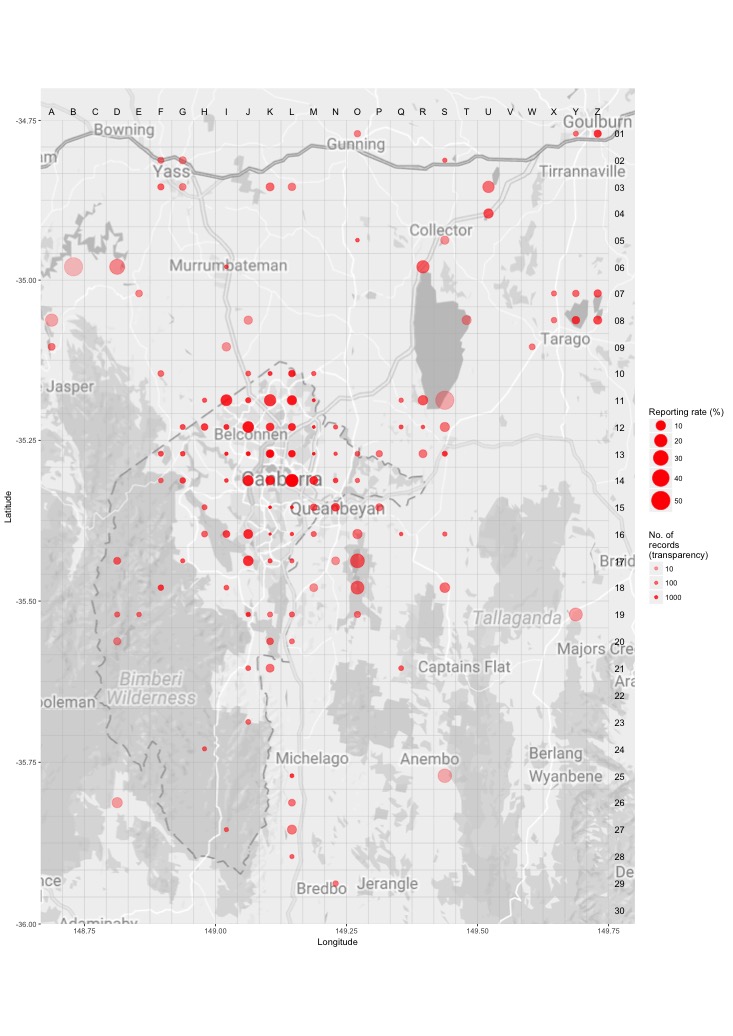
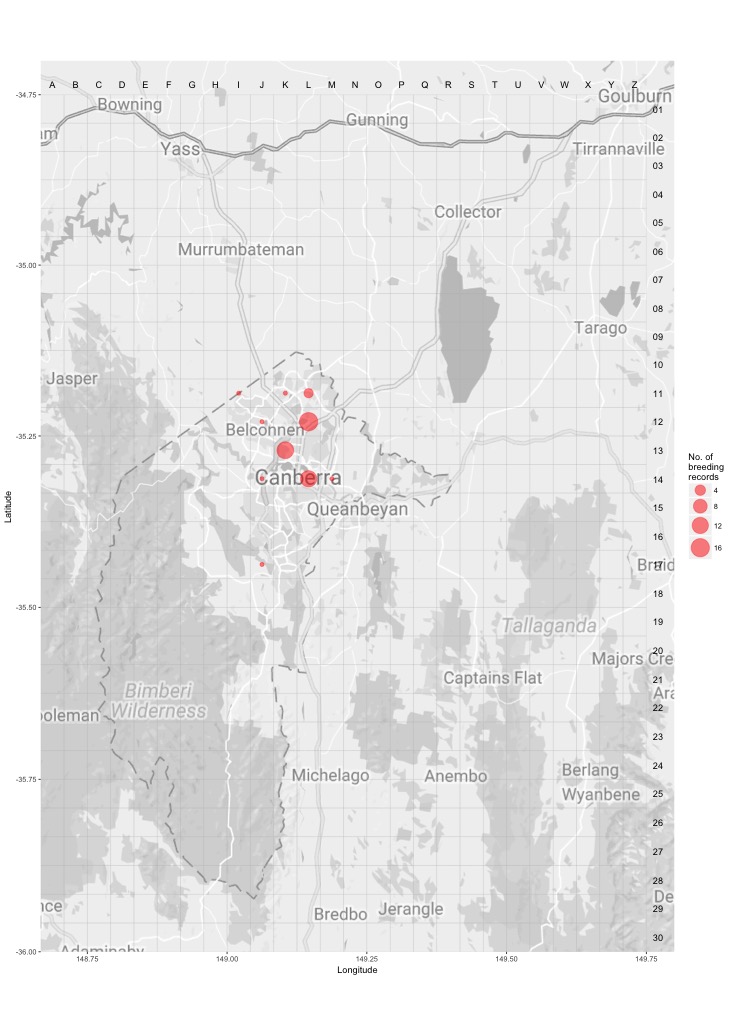
Breeding map
Breeding - 2017
This map shows the breeding distribution of the Little Black Cormorant for 2017.
The red circles are the grid cells where breeding activity for Little Black Cormorant have been reported.
The size of the circle represents the number of reports. 
Breeding - all years
This map shows the breeding distribution of the Little Black Cormorant for all years.
The red circles are the grid cells where breeding activity for Little Black Cormorant have been reported.
The size of the circle represents the number of reports.